


Software Delivery Managers (SDMs) have a lot on their shoulders: clients, Product Owners, CTOs and developers, engineers and testers who all want something. Meeting divergent stakeholder needs requires balancing an attention to detail with a broad ‘big picture’ view – achieving this means a cross-functional team is running effectively and on schedule. But the only way to be sure is to measure progress through metrics. Read on to get a first-hand account of how metrics can strengthen team morale and boost efficiency.
Measuring a development team’s productivity strengthens their confidence and delivers peace of mind to business representatives. I will share with you how I came to this conclusion – what caused it, which roadblocks were removed, how I managed to convince my teams and our clients to go along with it and what value we get out of it now.
There’re plenty of metrics available that help to gauge how efficient a team is, whether it’s progressing in the right direction and its level of agility. It seems to be like a paradox of choice – the more you have to choose from, the harder it is to make a decision. That was exactly my feeling when I started my journey with metrics. Now I know that while metrics alone are not the answer, they give us data to analyze, understand and value – if we can use them.
Metrics – how to start?
It’s likely you’ve heard a development team ask, “how much should we commit to delivering by the end of the sprint?”. Whatever answer you give, it will just be a guess. That’s because in a non-material service world you can’t give an exact prediction. All you can do is estimate – the more accurate it is, the better for your team and you. And this text presents how.
Each development team I worked with had some agile experience, understanding of software development complexity and developers with different levels of seniority. However, despite all this, they often struggled to deliver on time, for a long list of reasons. After investigating why, I concluded that it was largely because the probability of their work was completely random. At the beginning there was no data regarding past actions, so the teams based their decisions on gut feelings. While intuition can be helpful, it’s very subjective, and when it comes to a sprint commitment, it often doesn’t help out.
So how to decide how much work we should commit to? After a series of sprints and observations, I realized that to answer that question I needed to establish some conditions. First and foremost – I had to know our team’s capacity and understand how much we could deliver each sprint. To measure that I could either talk about items delivered or story points (I know many people hate them, but if you apply them in the right way, teams may start liking them and it will work). I also needed to view data in an empirical way, based on the team’s real experience. If there’s no data at all, the beginning is not easy. I needed to start collecting it.
Read also: Essential KPIs in software development
Learn about your team’s capacity
Every time I work with a new team I wait for the moment when they notice that without visualizing their capacity, they lose the ability to trace their team’s presence or absence. Sooner or later, that affects their ability to predict their work, plan and execute it in a timely manner and manage dependencies.
During one of the retrospectives, I asked my team how they can remember who’s in and out on a particular day and whether they realize how it impacts the team’s capacity and ability to work according to what they scheduled in the sprint planning. The answer was easy to predict.
The result of the retrospective was a team capacity spreadsheet, an easy tool created incrementally in excel. Each team member could mark their status regarding the sprint work – as long as the work they did was related to the sprint they said they were in. If they needed to focus on other activities (like helping another team) they just marked it as out or ½ (or any other available value). This built numbers regarding the team’s capacity and establishes the number of workdays.
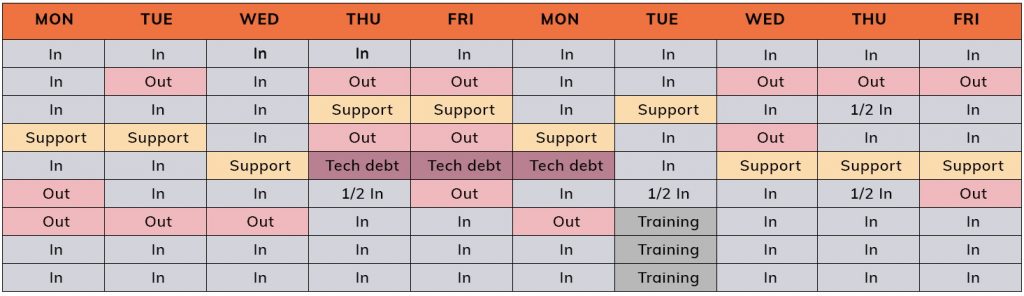
From that moment it was easy to measure and calculate how much time we needed to spend doing a sprint, provide support or conduct tech debt activities – obviously you can determine different priorities. We also knew how many workdays would be performed by developers and QA. That gave us knowledge about our capacity to build something within the sprint.
Give estimations and determine velocity
According to agile principles, working software is the primary measure of progress. At the beginning it’s easy to say that’s a really unfair principle, because it ignores all other types of work that are not pieces of working software. But that’s the point. As such, I coached the team to focus on their delivery rate. The well-known metric here is velocity, which provides information regarding the pace of your delivery completed to the done state. I used it as a base for a more complex metric and system that was built using that data.
I’ve read many interpretations of how to use (or not to use) story points. I talked with many scrum masters and agile coaches. And I believe that now, after spending so much time with them, I can say I agree with all pros and cons. But now I try to use them only in a way that delivers value – even if it’s not by books or breaks some rules.
That’s why one day, we switched from story points to t-shirt sizes. Yes, that’s correct. My teams don’t use story points (but I do!), they estimate using t-shirt sizes. It’s simply XS, S, M and L sizes. After an estimation is done, I add some real numbers to the letters – i.e., XS for me means 1, S is 3, M is 5 and L is 8 (these values were decided in consultation with the team). After the entire sprint I look at the summary report and collect data regarding the number of story points delivered to the status done (development and testing completed based on our definition of done). This value, gathered regularly, helps me determine velocity. That’s one of the ingredients in my mixture. Is it perfect? Nope. But it’s accurate enough, so it’s useful.
Over time we started collecting some other numbers ‘sprint by sprint’, like, the number of items completed. Using the same data, it was easy to measure the average size of a “done” item in a sprint and an average size of a “done” item overall. The unit of this size is a story point. That also helps the team to realize what is the most relevant and most often delivered size of a user story (or another type of work). In our t-shirt size system, it’s S. That helps us because, if we review the data, we can clearly see that having relatively small items makes it easier to complete them on time.
Perhaps it’s just a coincidence, but my instinct tells me that it’s usually easier to perform at a higher level with a smaller task than with a big one.

Epilogue – derive more value out of metrics
You can collect data, but if you don’t review it, it is just useless numbers. I realized that when I started analyzing data. Then I noticed that by combining metrics, I can generate some practical insights for my teams! The answer to the legendary question of how much can we commit to in order to deliver what’s achievable was closer than ever before! But… to be honest, I still don’t know the exact answer. However, the goal is to be close enough to the right answer and have enough information to bravely progress with work and not to fail each sprint. And that’s what we have achieved!
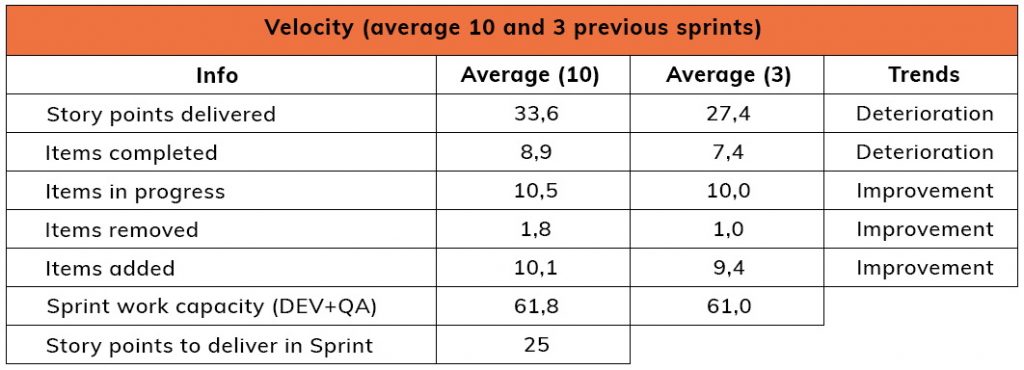
After starting to measure velocity, over time, we added some additional metrics. Now we focus on story points delivered each sprint. We also care about the number of items delivered, items in progress (which are not delivered, but present in the sprint backlog on the very last day of the sprint), the number of items removed from the sprint backlog and items added to the sprint. This data is analyzed with the perspective of the previous 3, 5 to 10 sprints. That helps us see the trends – whether we are getting better or worse over the time. After some time, I began to see that the metrics regarding the number of items removed and added don’t give us enough value, so it’s likely we will stop collecting them soon.
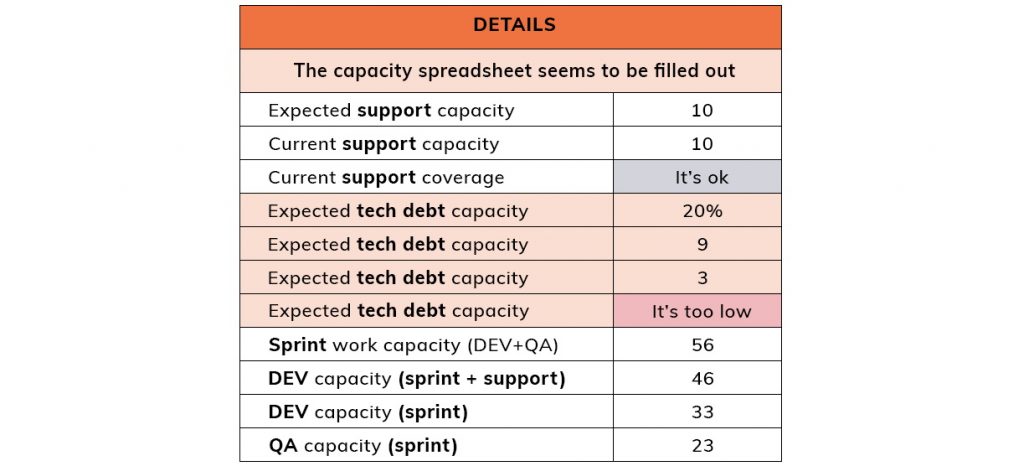
But that’s not all. As we have enough data about the team’s current capacity (and the historical data as well) and the velocity, we can combine everything together. This led us to the most powerful metric at the team level, which addresses our needs and helps us in planning the sprint commitment. This metric, or rather calculation, is the expected number of story points to deliver in the upcoming sprint. In other words, we can predict, with considerable accuracy, how much work we can complete during each sprint.
At the beginning of each sprint, during the sprint planning session, we ask teams to fill out the capacity spreadsheet. We also add some data regarding the previous sprint achievements (story points delivered, items completed). Since we know our current and previous capacity and velocity, we can easily calculate the potential number of story points that the team should deliver. But be aware – it will always be only a rough calculation. Excel doesn’t see our context, doesn’t understand that some senior developers were, are or will be out during the sprint. The number we get is not the answer, it’s rather a hint we can use to decide on how much we can commit to. And guess what – each team uses it now as a tool to answer the question of how much work they believe they can deliver. Doesn’t it sound great? I know, it does! And yes, the team also likes it! Obviously, the precondition for having that answer is to be systematic in terms of collecting data and having a regular, repeatable estimation process. At the start, some developers may have doubts, but the sooner you can prove it delivers value, the sooner they’ll start doing all the jobs with excel by themselves. This delivers predictability and the feeling that we can guess based on real, empirical data, not on intuition alone.
The journey with metrics
It’s more than likely that when you read this text, we have updated our approach and slightly changed how we use our collected data. Some data, I bet, we have given up collecting, while new data has shown itself to be useful. I encourage you to try the system described above and to experiment with it. And remember – this system was created from scratch, and it took almost three and a half years to evolve to its present form. Be patient and collect only useful metrics. Review them, analyze, challenge yourself, consider data from different angles, look for answers or data that will bring you closer to finding them. Only then you can transform your lagging metrics into real value for you and your teams.
If you’re looking for more practical insights, real-world reflections and battle-tested strategies, fill out the form and get in touch with one of our experts.

About the authorHubert Ochmański
Software Delivery Manager and Scrum Master
A Software Delivery Manager and Scrum Master with 10+ years’ experience in Agile and Waterfall project management, Hubert combines conventional and modern approaches. Co-creator and co-implementer of Agile transformation in multicultural, international projects, he works with cross-functional development teams, product owners and customer management specialists to build efficient software delivery processes. Outside of work, Hubert has spent over 1,500 hours training others in project management.